![]()
| Introduction to the "Mpemba Effect" | |
|
The
Mpemba effect
is the observation that warmer water can sometimes freeze faster than colder water. Although the observation has been verified, there is no single scientific explanation for the effect. On the 26 June 2012, (I heard it on World at One ) the Royal Society of Chemistry in UK sponsored a £1000 prize to anyone that can solve this puzzle, with a closing date of 30th July 2012. Here is my theory, supporting experiments and inventions developed to take advantage of the effect. |
|
| Theory | |
|
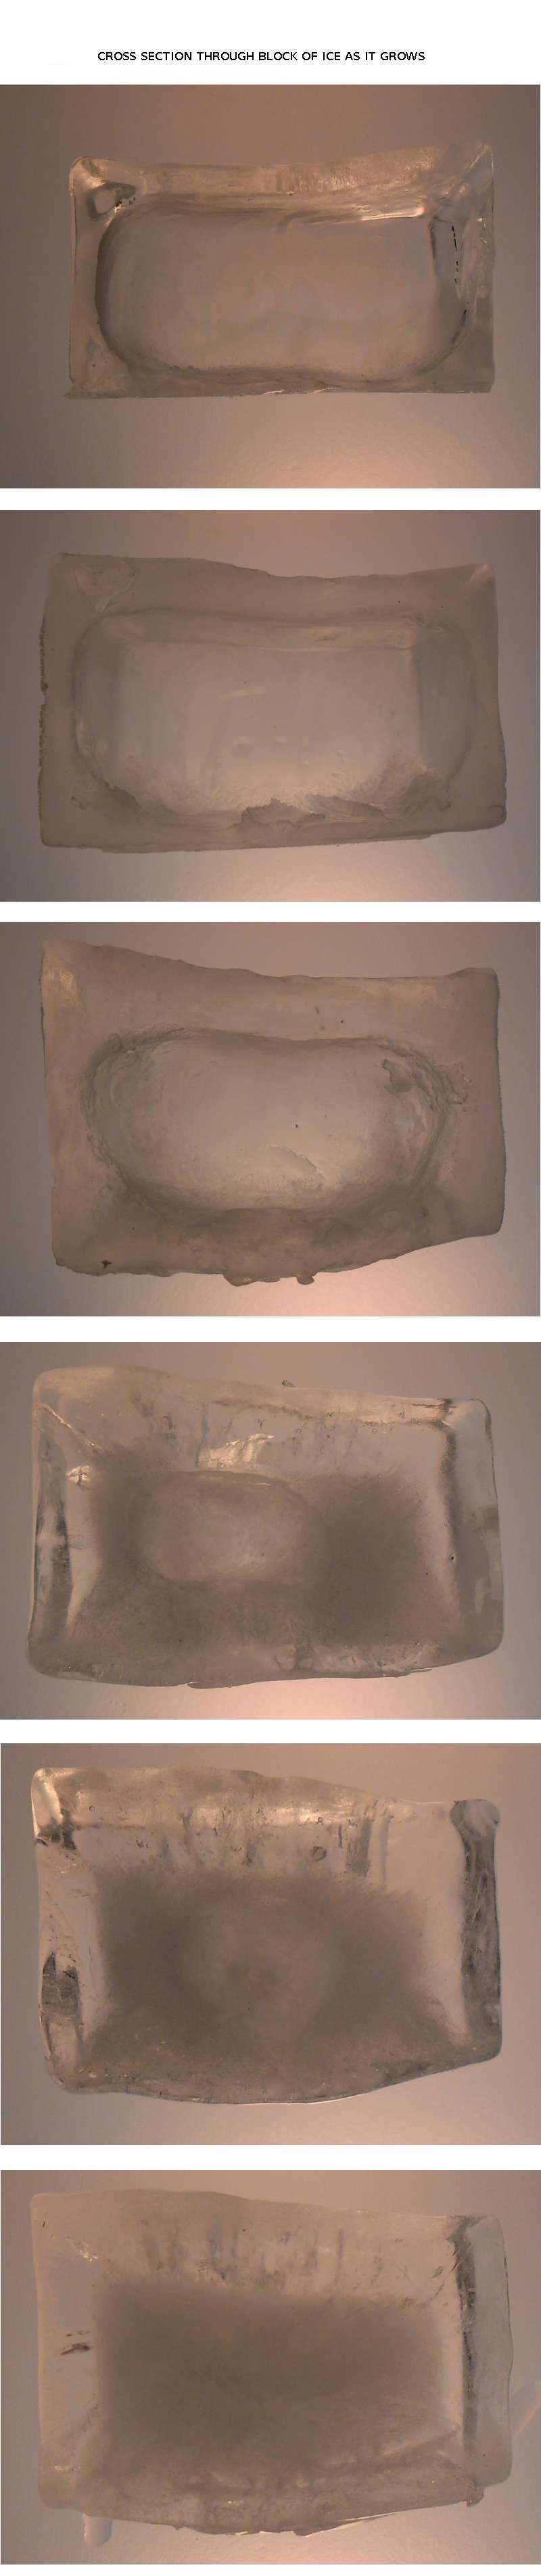
Both "cold start" and "hot start" water samples cool at similar rates until they reach a "plateau" in temperature at or near 0°C. At the end of the "near 0°C temperature plateau" (most or all of the water has turned to ice), the measured temperature continues to fall. The "near 0°C temperature plateau" is explained by the latent heat of transforming water at 0°C to ice at 0°C. This is where we find a difference between "cold start" and "hot start" water samples and the the reason for the "Mpemba Effect". The growth patterns of ice crystal for both "cold start" and "hot start" water samples in a container with open top are the same. Basically, the ice "grows" from the surface, sides and bottom of the container towards the centre, leaving a "trapped cube or sphere" of water surrounded by ice. For the "trapped cube/sphere" of water to freeze, it's heat must travel through the outer ice. Ice crystals grown from water that started cooling from a higher temperature ("hot start") are better thermal conductors than ice crystals grown from water that started cooling from a lower temperature ("cold start"). Why? Water that started cooling from a higher temperature has a higher concentration of hydroxide (OH-) ions than water that started cooling from a lower temperature. When the "hot start" water sample reaches the "near 0°C temperature plateau", the higher concentration of hydroxide ions cause the ice crystals to form structural ice with a better thermal conductivity. When the surface ice (and eventually side and base ice) has formed, it is still necessary to transport heat away from the water surrounded by ice and better thermal conductivity of the ice from the "hot start" water means that the water that started cooling from a higher temperature achieves "frozen" status quicker. My Experiment 7 shows that increasing the concentration of hydroxide ions in a cold water sample using some simple electronics causes it to freeze faster than an untreated cold water sample and in fact it freezes faster than a boiling hot water sample. My invention, the HIVE resulting from this theory & experiments has practical applications - e.g. a "fast ice cube maker for bars & restaurants" using water from the "cold tap". # 
The "reverse Mpemba Effect" noted in my Questions raised by initial observations following Experiment 1 i.e. when ice thaws, compacted snow (snowballs & snowmen) survive longer on the ground than uncompacted snow can also be explained by this theory. The liquid water for the source of ice formed in clouds was at low temperature and therefore the ice has a low thermal conductivity. Compacted snow form this low thermal conductivity ice melts slower than uncompacted snow. The only difference between the "Mpemba Effect" and "reverse Mpemba Effect" is the direction of heat flow. |
|
| Experiments | |
|
On the (correct) assumption that I know nothing, my strategy is to perform an experiment to reproduce the effect. If that experiment is successful, examine the results with a view to performing another experiment to learn more. Repeat experimenting and learning until a plausible theory emerges. |
|
| Equipment | |
|
Complete details of the equipment used in the experiments can be found
here
. Basically whatever I had to hand. The possibility of winning the £1000 is very small so I'm using the philosophy of Monty Python - "you come from nothing, you're going back to nothing. What have you lost? Nothing! |
|
| Experiment 1. - Can I reproduce the effect and see it for myself? | |
|
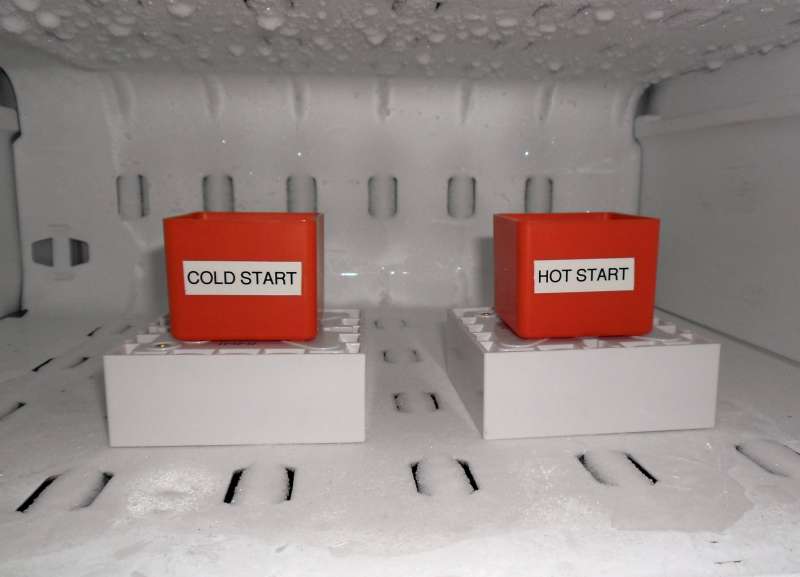
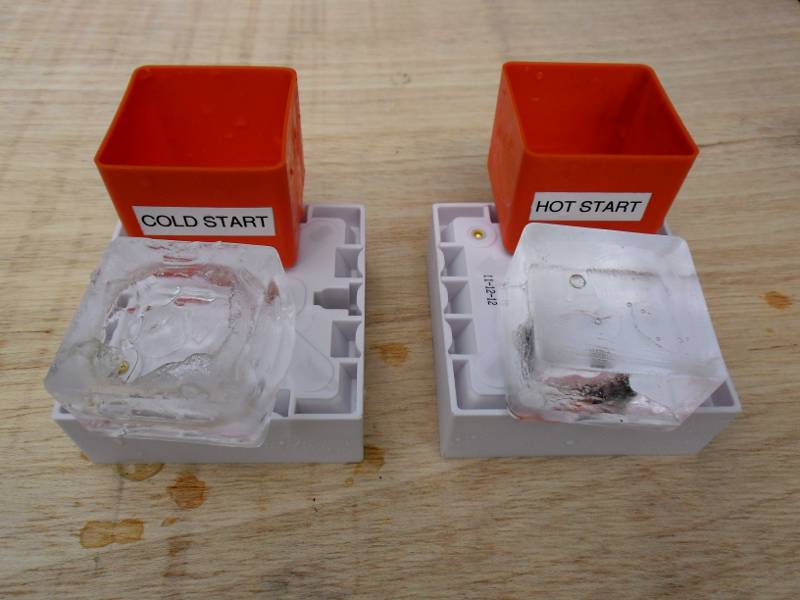
Two identical containers were filled with water samples (75cc), one sample from the "cold" domestic water
tap (faucet for our American friends) and one from the "hot" tap. Both containers were placed on the top shelf of a domestic freezer, each with it's own on insulating block (actually an electrical surface pattress ). After 2 hours, both containers were removed from the freezer and the contents examined. |
|
| Experiment 1 Conclusion | |
|
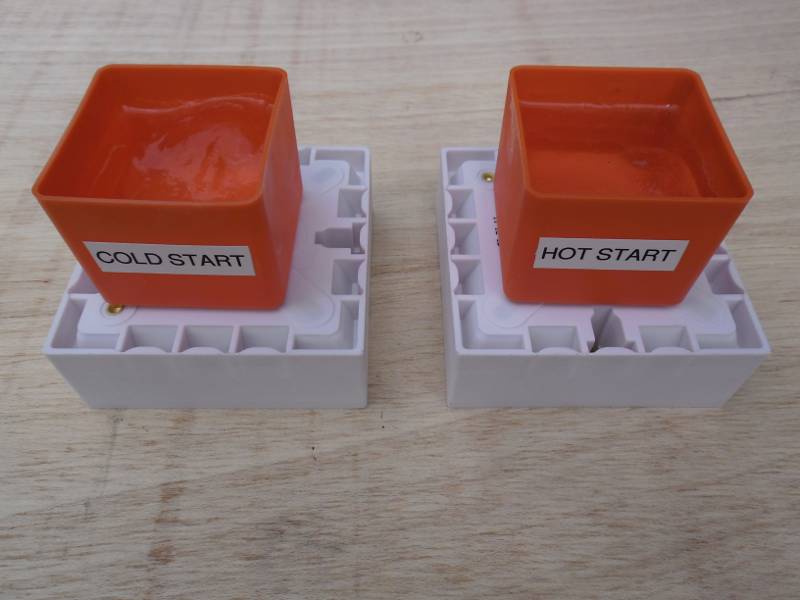
I can reproduce the "Mpemba effect". Observations:
Questions raised by initial observations:
|
|
| Equipment 2 - Baseline Temperature Measurements | |
|
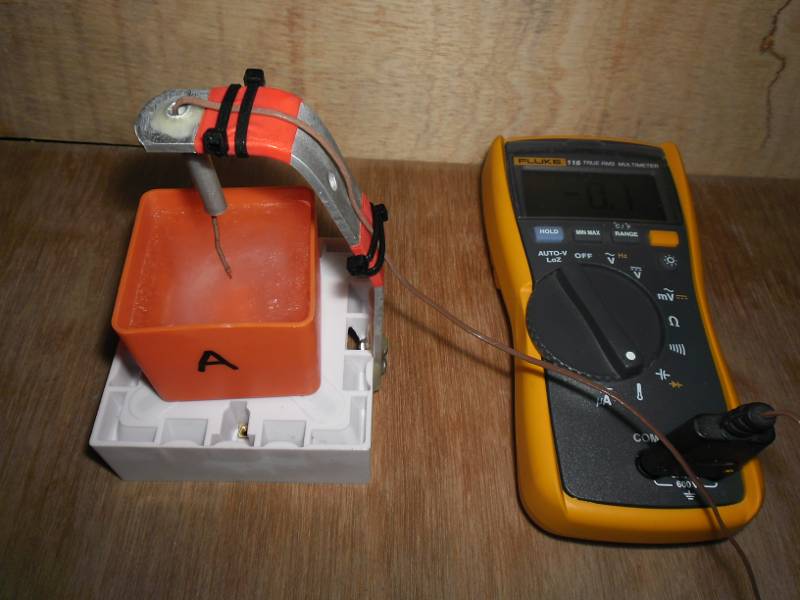
Objective: Build a test rig to hold a thermocouple in a fixed and repeatable position in the freezing sample container and measure the temperature profile of a cold start and hot start sample under the same conditions. Predictions: I would expect to see the rate of temperature change in the hot start sample exceed that of the cold start sample. The experiment: Perform two identical experiments, one with water from the "Hot Tap" and the other with water from the "Cold Tap". The water sample (75cc) was poured into container "A" and placed on the test rig, where the complete assembly was cooled in the freezer. Temperature measurements were made every 60 seconds remotely via a thermocouple probe located just below (approx 4mm) the surface of the water sample connected to a digital thermometer outside the freezer. |
|
| Experiment 2 Conclusion | |
|
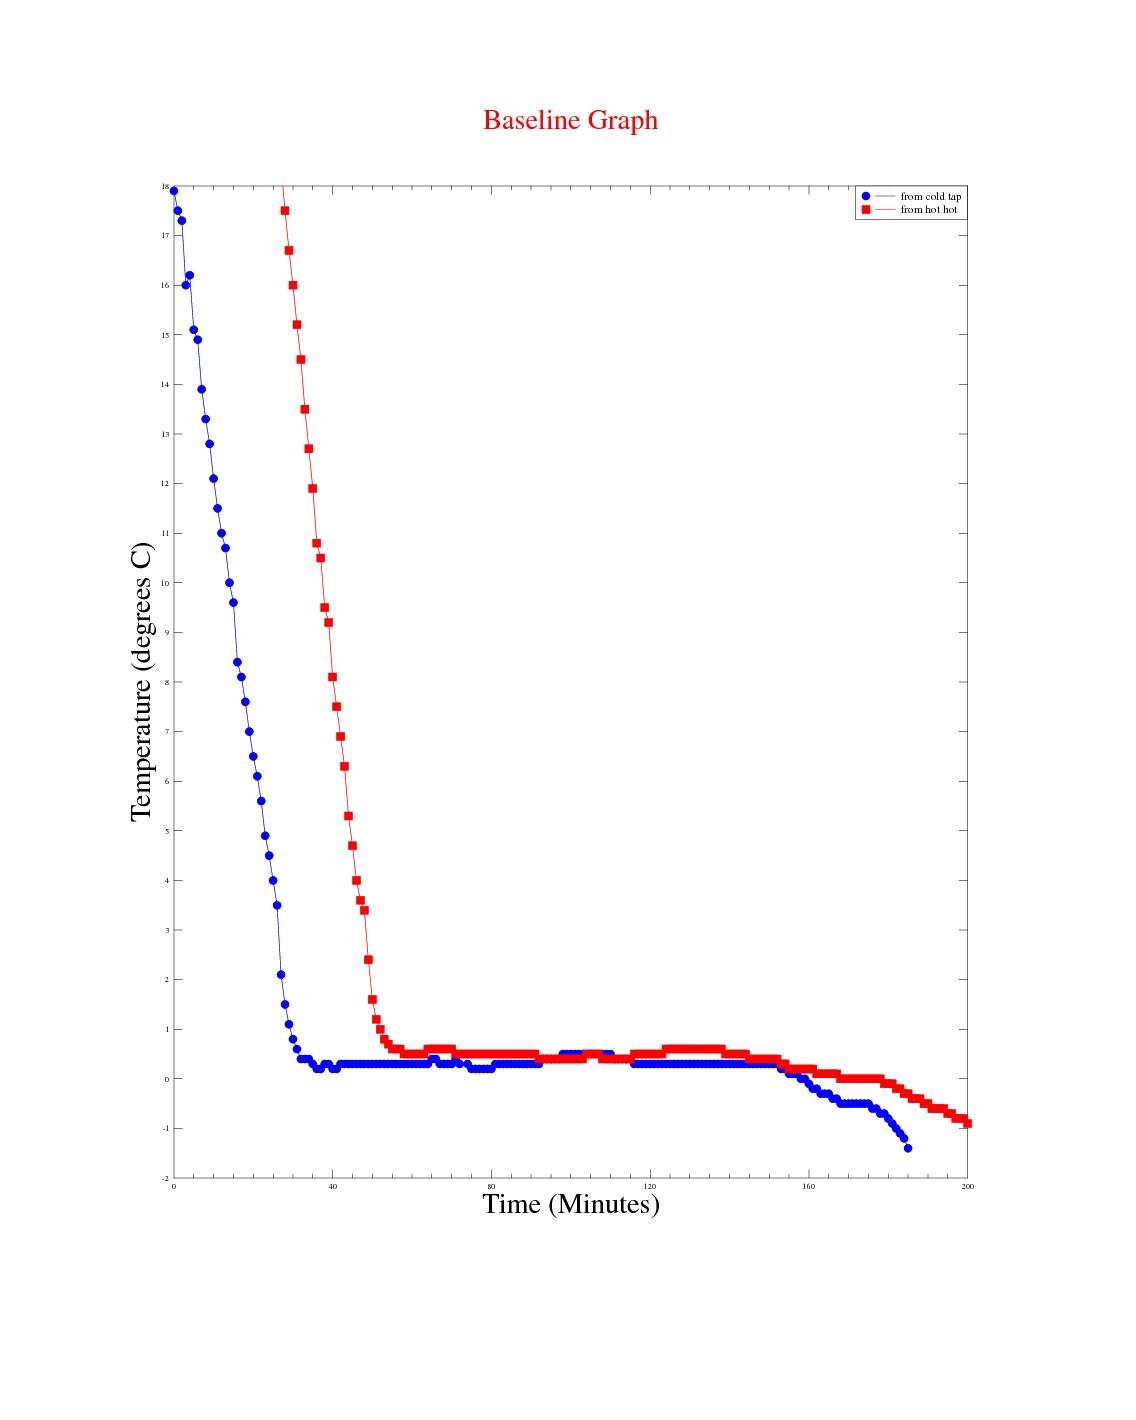
Observations: The measurements show that both samples reached a temperature plateau, just above 0°C where they both stayed for a long time before the temperature continued to drop into negative temperatures at a higher rate of change. The assumption is that the latent heat of water at 0°C to ice at 0°C held the temperature near 0°C for such a long time. Once the container was full of, ice the rate of temperature drop increased. The time difference between freezing the cold and hot start samples were similar, however the hot start sample took approx 27 minutes to reach the initial temperature of the cold start sample. Without the "Mpemba effect", I would expect the hot start sample to remain cooling for another 27 minutes. Issues raised by the observations: As it is not possible to know if a measurement of 0°C is from the thermocouple immersed in liquid water or ice, I have decided to use the point in time at the end of the "near 0°C plateau" where the temperature falls below -1°C as the "frozen" point. |
|
| Experiment 3 - Using a pair of "Piezo Transducers" | |
|
Objective: Modify the test rig to move the position of the thermocouple nearer the surface of the water to speed up future test runs. Two existing theories on the Mpemba effect suggest:
Attach a pair of piezo electric transducers to a container as a method of vibrating the water as it freezes with the dual objective of -
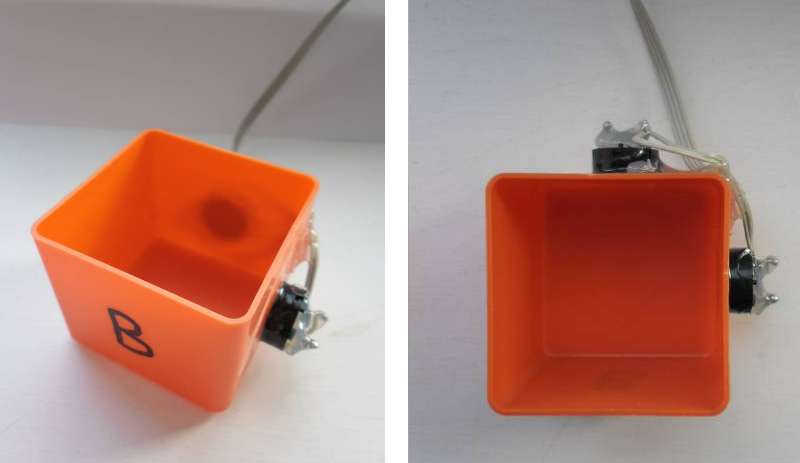
Predictions: If the Mpemba effect is due to currents in the hot start sample, we would expect to see our cold start sample cooling quicker than normal with the piezo transducers active, producing "simulated currents" in the sample. If the Mpemba effect is due to a reduction in surface tension in the hot start sample, we would expect to see both hot start and cold start samples taking longer to freeze, with the piezo transducers active, but with the hot start sample freezing quicker. All samples are disadvantaged by the liquid water vibrating where it is in contact with the container, but the relative advantage of the hot start sample should be preserved. The experiment: In order to determine the effect of vibration on water touching the side of the container, I attached a pair of Piezo electric transducers (similar to the sounder found in smoke alarms etc.) attached to some electronics to produce a sweep in frequency. The Piezo transducers were attached at 90° to each other and fed from a pair of drive voltages at 90° to each other. |
|
| Experiment 3 Conclusion | |
|
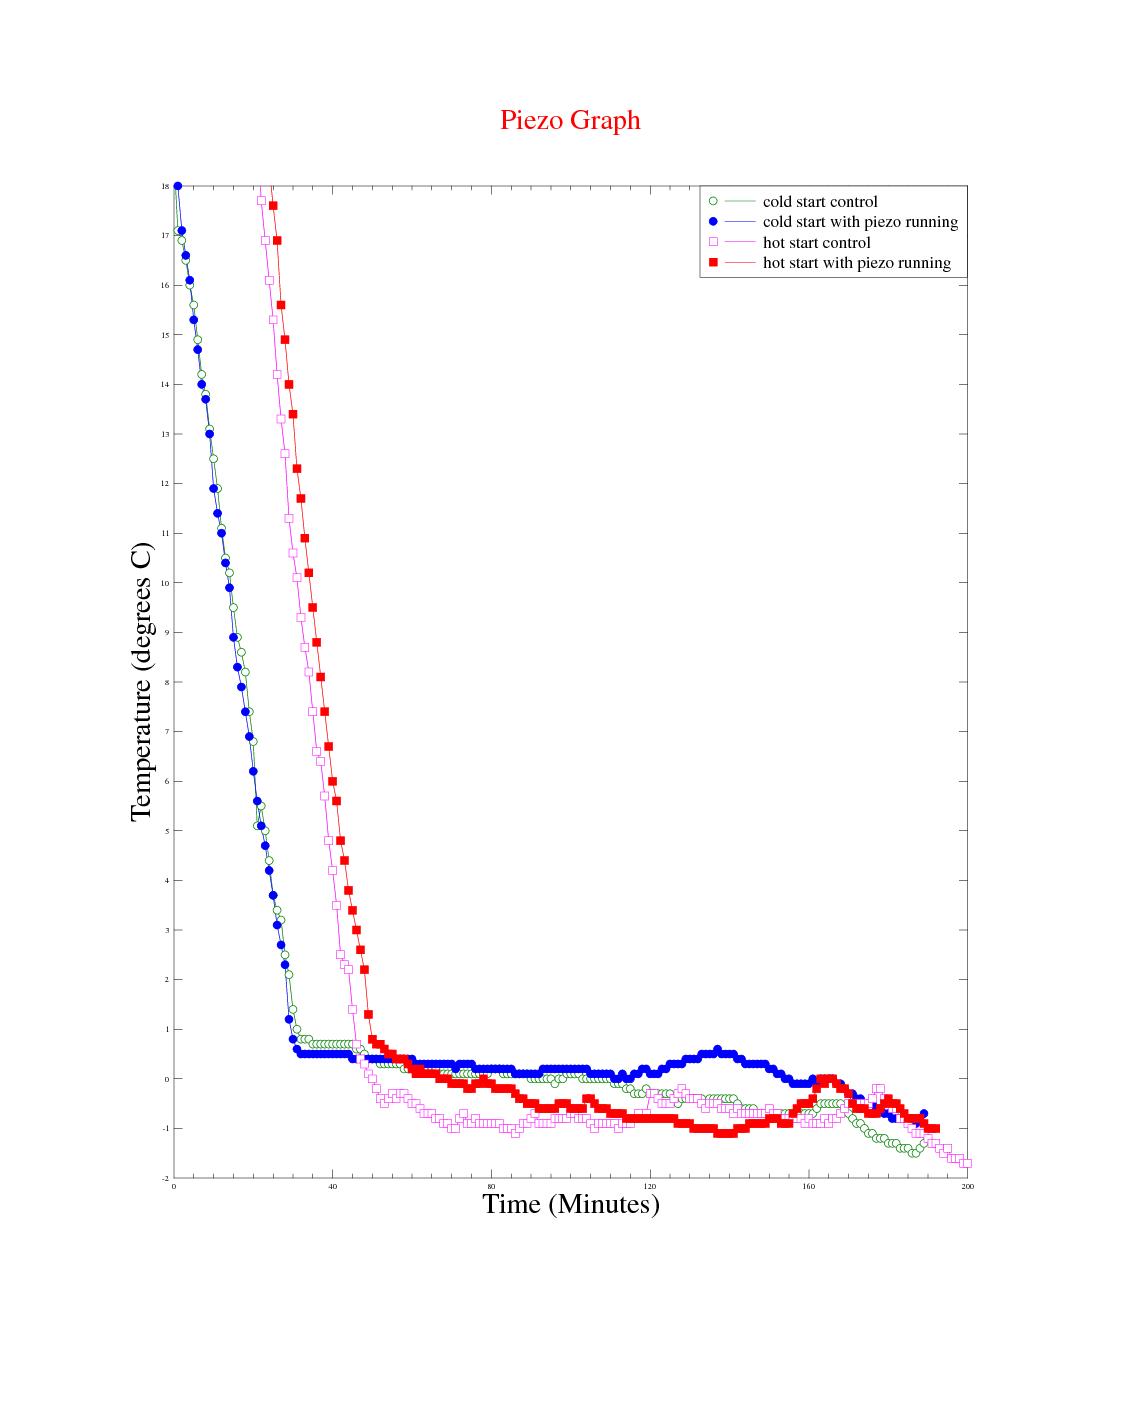
Observations: Moving the thermocouple closer to the surface of the water did not reduce the time for a test run. In hindsight, I should have expected that! The temperature at the surface will not fall too far below 0°C until all the water has turned to ice. Activating the piezo electric transducers had either a marginal adverse, or neutral effect on the system. Maybe it is not possible to create suitable currents in the water by vibrations from piezo electric transducers. It may not be possible to influence surface tension in this way either. Also, adding energy to the system in the form of mechanical vibrations may explain the marginal adverse effect at the end of the "plateau" region for the "cold start with piezo running" test, where the temperature peaked to approx 1°C above the control sample. Issues raised by the observations: It may not be possible to influence currents in the water or surface tension using piezo transducers mounted on the outside of the container. |
|
| Experiment 4 - Measuring "Electrical Resistance" during a test run | |
|
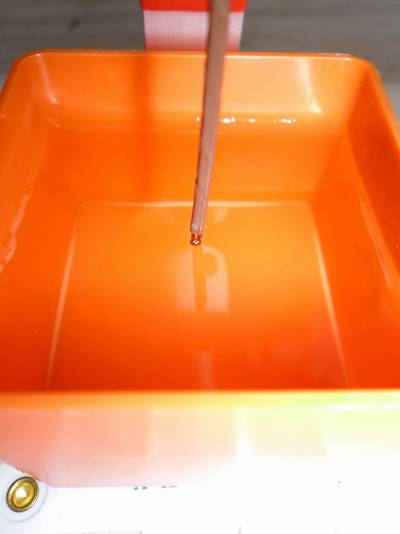
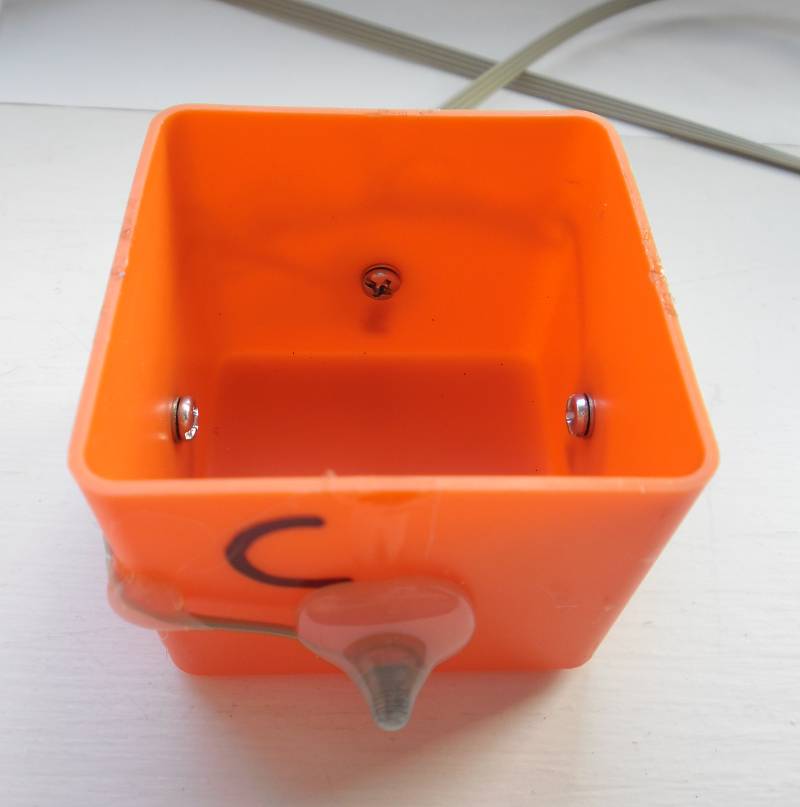
Objective: I know that water conducts electricity and a sample of cold tap water subjected to 50V DC showed signs of electrolysis without the addition of an electrolyte, but does hot water conduct electricity better than cold water? # 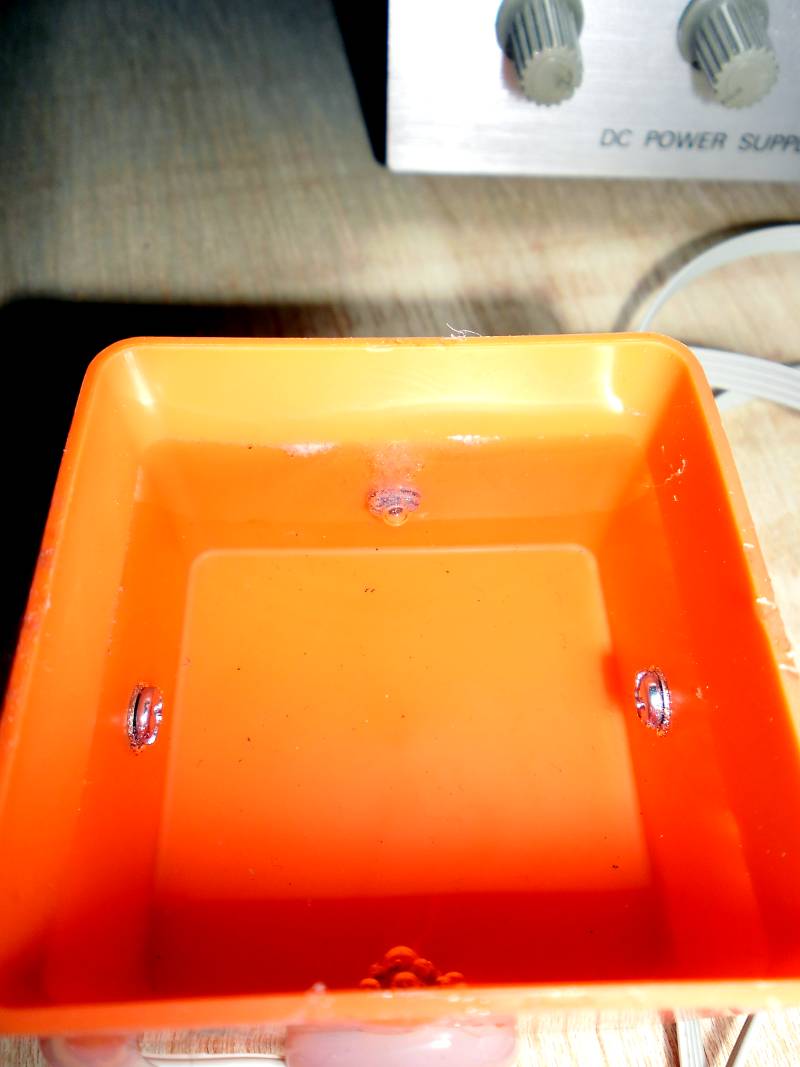
Container "C" with 50V DC connected between two opposite electrodes, showing Hydrogen & Oxygen bubbles from the relevant electrodes. Predictions: I would expect hot water to conduct electricity better then cold water because it has a higher concentration of hydroxide (OH-) ions. As the "hot start" sample cools, maybe the concentration of hydroxide ions (and electrical conductivity) is higher than a similar "cold start" sample at the same temperature. The experiment: In order to determine the effect of cooling on the electrical conductivity of water I found that the measuring the resistance with a digital multimeter was unreliable. Even measuring resistance with an analogue meter caused unreliable results unless the polarity was swapped between electrodes (approx. every second) and take an average reading. The resistance readings tended to start at a level once the switch was thrown, then drift higher over a few seconds. On throwing the switch again, the resistance readings stabilised, but drifted higher again. |
|
| Experiment 4 Conclusion | |
|
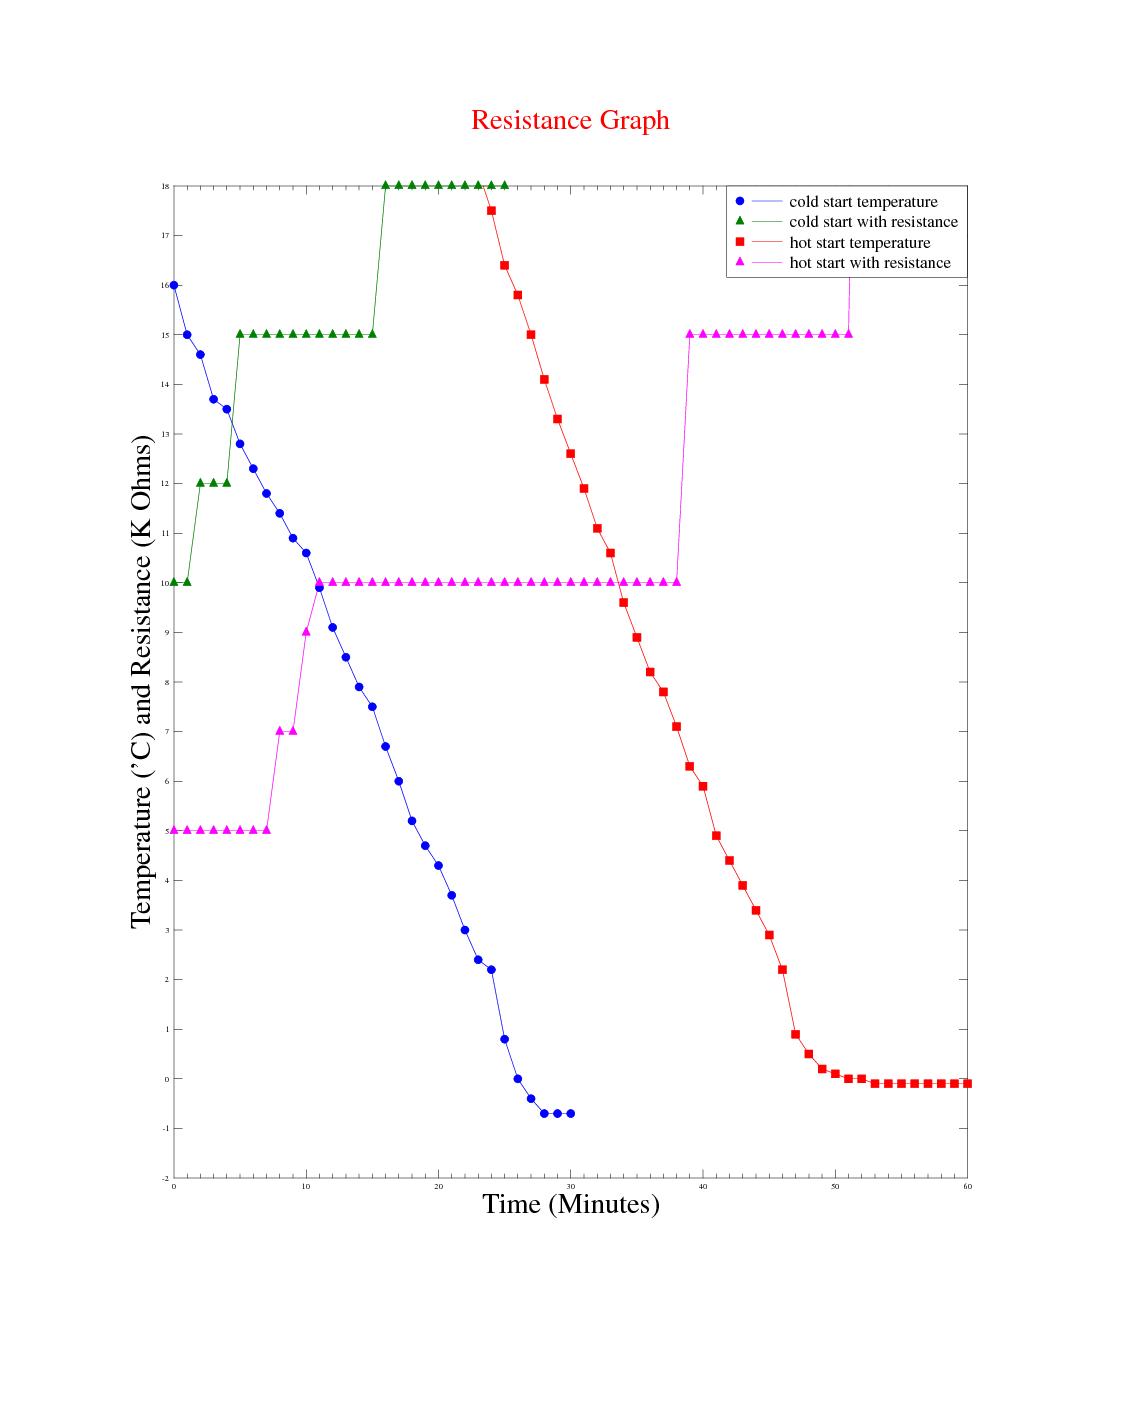
Observations: The readings obtained were very unstable, but suggested at a different rate of change of resistance with temperature for cold and hot start samples. |
|
| Experiment 5 - Does "Hydroxide Ion" stimulation during cooling have an affect? | |
|
Objective: Build an "ion drive" to increase the concentration of hydroxide ions in a cold start sample, so it behaves like a hot start sample (i.e. freezes faster than a control sample without the "ion drive"). Predictions: The cold start sample should freeze faster with the "ion drive" operational. The experiment: In order to determine the effect of stimulating the Hydroxide Ions of the water touching the side of the container, I attached 4 electrodes (one on each side of the container), below the water level attached to some electronics to produce a rotating two phase electrical field from a pair of drive voltages at 90° to each other. |
|
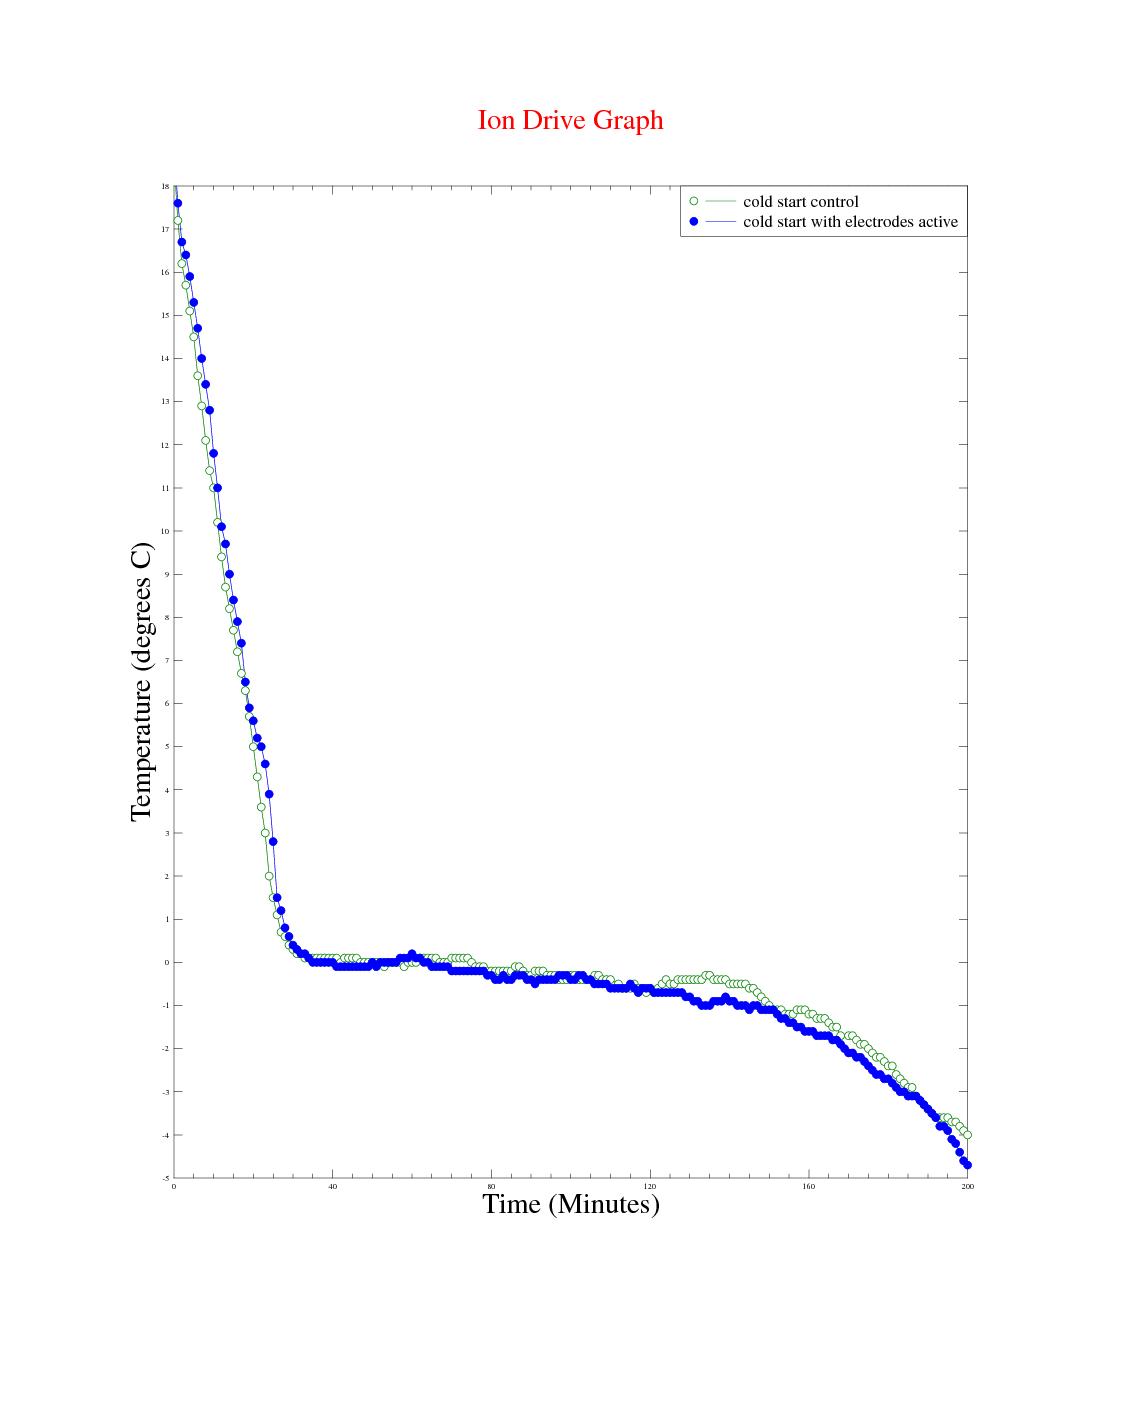
| Experiment 5 Conclusion | |
|
Observations: Marginal or neutral effect on the cold start sample, however this experiment was only run once as it's time to publish my theory. The electrodes helped transport the heat from the "trapped cube/sphere" of water inside the ice, giving a different profile than unmodified containers. Issues raised by the observations: The possibility of using an "ion drive" or electrolysis device to speed up freezing of cold water. The possibility of using a "passive device" to speed up freezing of cold water. |
|
| Equipment 6 - Boiling water v Cold Tap water | |
|
Objective: Freeze water from the cold tap, logging temperature until it reaches at least -5°C. Freeze boiling water, logging temperature until it reaches at least -5°C. Predictions: I would expect to see the rate of temperature change in the boiling sample far exceed that of the cold start sample. |
|
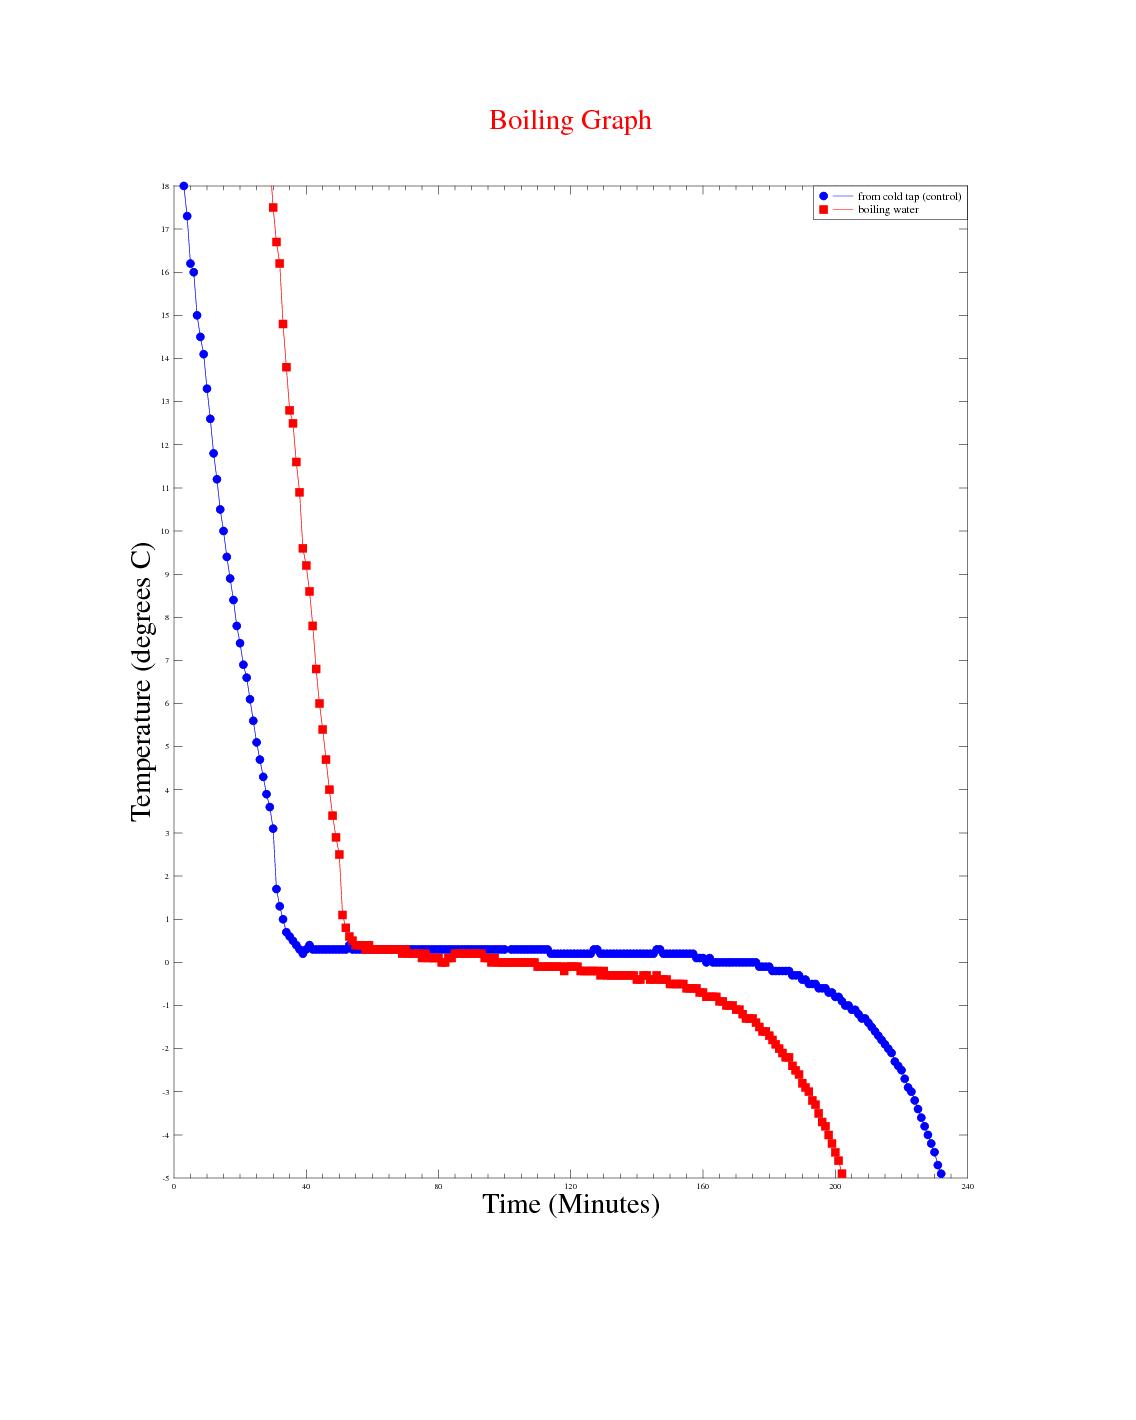
| Experiment 6 Conclusion | |
|
Observations: Extending the test time gives a better overall picture of the temperature profiles for both samples. Boiling water behaves as predicted, compared to the cold start sample. |
|
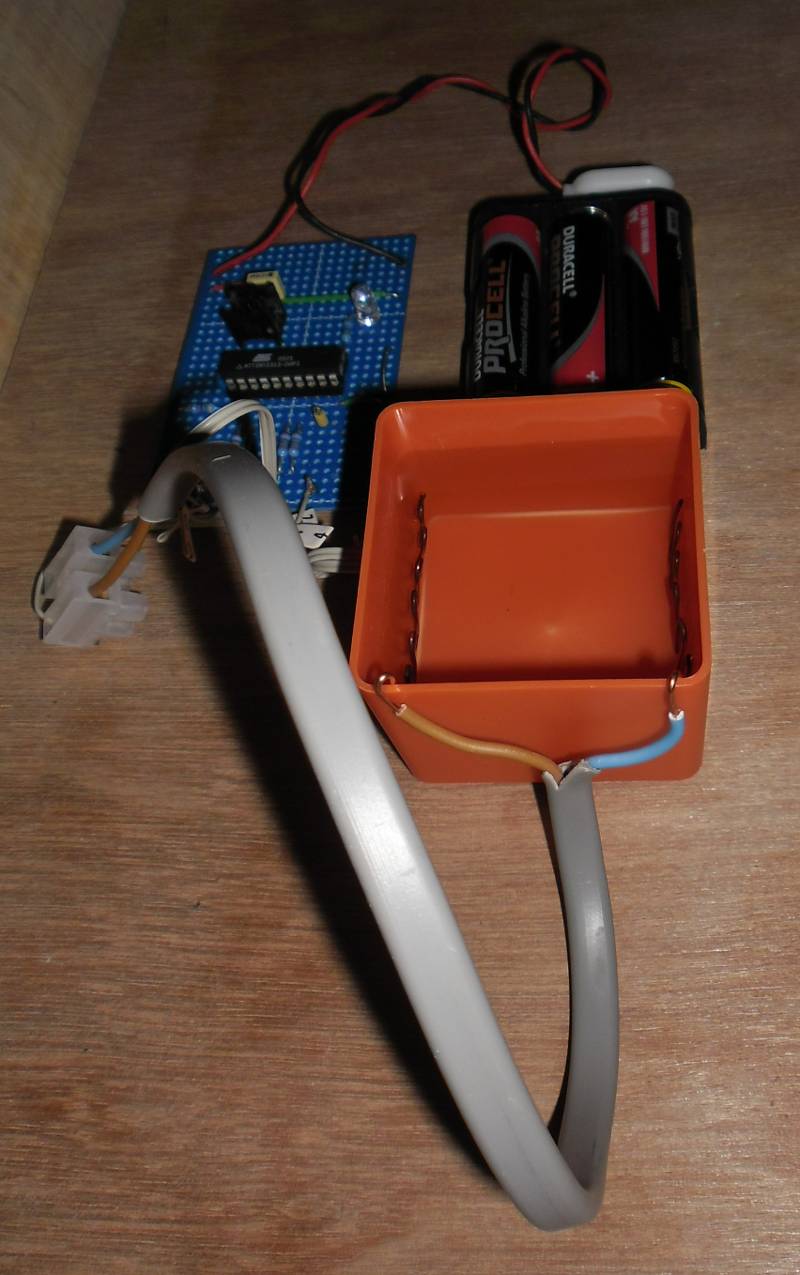
| Equipment 7 - Ion Drive MK2 | |
|
Objective: Treat a sample from the cold tap, with the MK2 Ion Drive for 30 minutes. Remove the Ion Drive electrodes and freeze the cold start sample as normal. Predictions: I would expect to see the rate of temperature change in the treated sample exceed that of an untreated cold start sample, but not as good as the boiling hot start sample. |
|
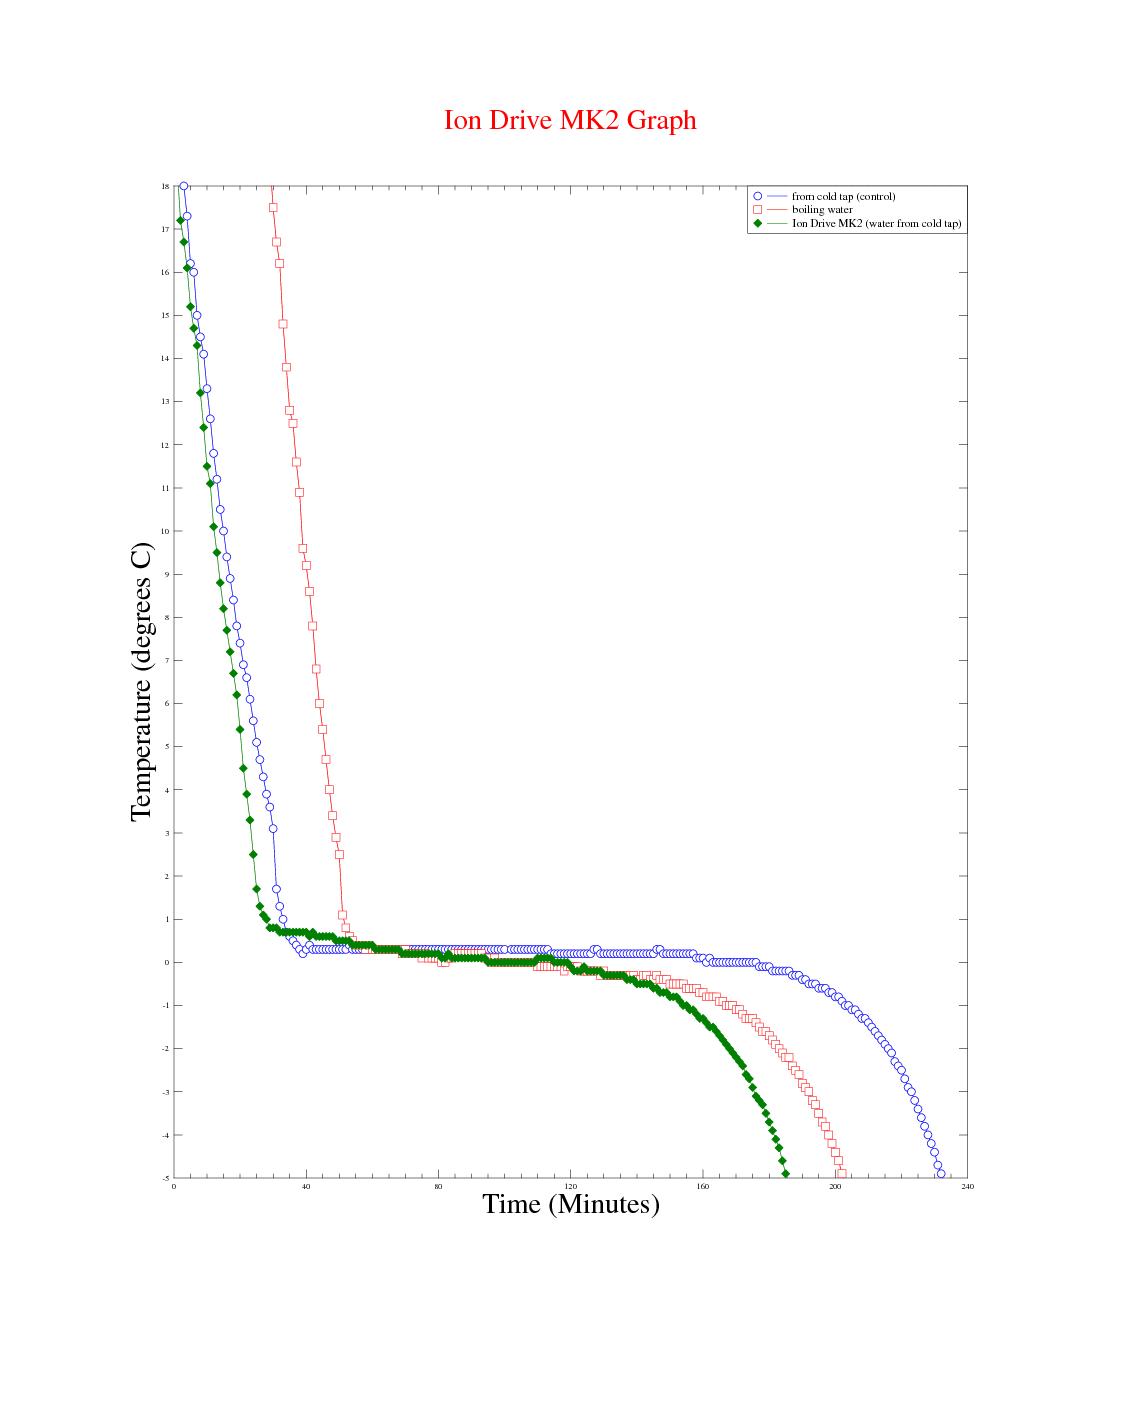
| Experiment 7 Conclusion | |
|
Observations: The "ion drive MK2" treated cold sample behaved much better than expected - in fact better than the boiled water sample. Issues raised by the observations: Copper electrodes were used and became tarnished during testing. It may be necessary to use inert electrodes. The same container was used to freeze the treated sample with the electrodes removed - would treating the sample and transferring the sample to a new container have the same effect ? |
|
| Inventions | |
|
Patents v Open Source Protecting an invention by patents (or other intellectual property rights) doesn't work. As soon as your patent is raised, the invention is open to either blatant copying or teams of people finding "holes" in the patent to exploit your invention without infringing the patent. Even if your invention is granted a patent, you then have to protect it by challenging infringements in court - not a cheap process. It doesn't help that large corporations patent trivial and obvious inventions to block competitors developments and "muddy the waters". The Open Source model as used in software development seems like a better option. GLE the "Graphics Layout Engine" used to graph my experimental data is a typical example of Open Source Software. Basically, you describe your invention, effectively "giving it away". This gives other inventors the opportunity to improve your invention and describe their improvement in the same way that you described your original invention. That's all very well, but how do you make money from an invention released under the Open Source model ? You are free to use your invention (with or without improvements) in your own products but without the cost & resources to police patent infringements. Your invention becomes a "showcase" of your talents & abilities for all to see and can be used to promote your business. In effect, you become the "go to guy" or "go to business" for this invention or related inventions. The inventor will always have more knowledge of the invention than "copycats" because of the route taken during development. Also note that published details of the invention is in fact a historic document and further improvements are always under way. Think of the Open Source invention as "freeware" with extra features, support etc available form the inventor on a "paid for" basis. All my inventions described during the experiments are released under the Open Source model. Variations of the inventions are not patentable and they now have "prior art" status. If any of the inventions in any way helps your business, you may use them licence free. It is your responsibility to ensure that they are safe and suitable for your intended application. The invention(s) are provided "as is", without warranty of any kind, expressed or implied, including but not limited to the warranties of merchantability or fitness for a particular purpose. In no event shall the author(s) or copyright holders be liable for any claim, damages or other liability, whether in action of contract, tort or otherwise, arise from, out of, or in connection with the invention(s) or the use or other dealings in the invention(s). In general, and with the lack of an Open Source licence specific to inventions, the spirit of the GPL licence shall be followed. Be lucky, live long and prosper! |
|
|
A "passive" device to speed up freezing of cold water - the "Quinn Device": A metal bar or tube from the water sample to outside the container with the purpose of transporting heat to the outside world at a faster rate than through the ice. This invention covers all materials, shapes, locations, orientations and sizes of bar or tube and applies to all liquids. # 
Example use of the invention. Example application - "fast freeze" picnic hamper ice pack. |
|
|
An "active" device to speed up freezing of cold water - the "Hydroxide Ion Drive" or "HIVE": Two or more electrodes are placed in cold water, connected to a source of low frequency alternating current with the purpose of increasing the hydroxide ion concentration in the cold water. This invention covers all materials, shapes, locations, orientations and sizes of electrodes, all electrical voltages, frequencies & phase relationships and applies to all liquids. The electrodes can be either removed or remain in the container before freezing. The liquid can be frozen in the original container or transferred to another container or containers before freezing. Feedback from monitoring the liquid while the HIVE is running and adjusting the drive parameters etc may improve performance. # 
Example use of the invention. Example application - fast ice cube maker for bar/restaurant using water from the "cold tap". |
|
| What Next ? | |
|
This web page detailing my theory & experiments on the Mpemba Effect started out as an "exercise in problem solving", using methods I have learned and developed over many years. Everything is here, including the experiments that didn't work (e.g. Experiment 3), but note that even though something doesn't work, you can still learn from it (the electronics from Experiment 3 was re-used with minor modifications for something that worked very well indeed - Experiment 7). I have not used complex mathematics, or tried to fit existing knowledge of thermodynamics to the theory - that needs to happen later. It's more of a logical explanation of the effect using vary basic research in the short timescale specified while keeping the "day job" going. All the information you need to reproduce the experiments is here. If you find something that needs clarification, email me and I'll fix it . This theory may or may not be valid, but if it is, using a Newton analogy - the apple is still on the tree. In fairness to other candidates for the RSC prize, this is the end of my submission, but I will upload any additional relevant work to this page . |
|